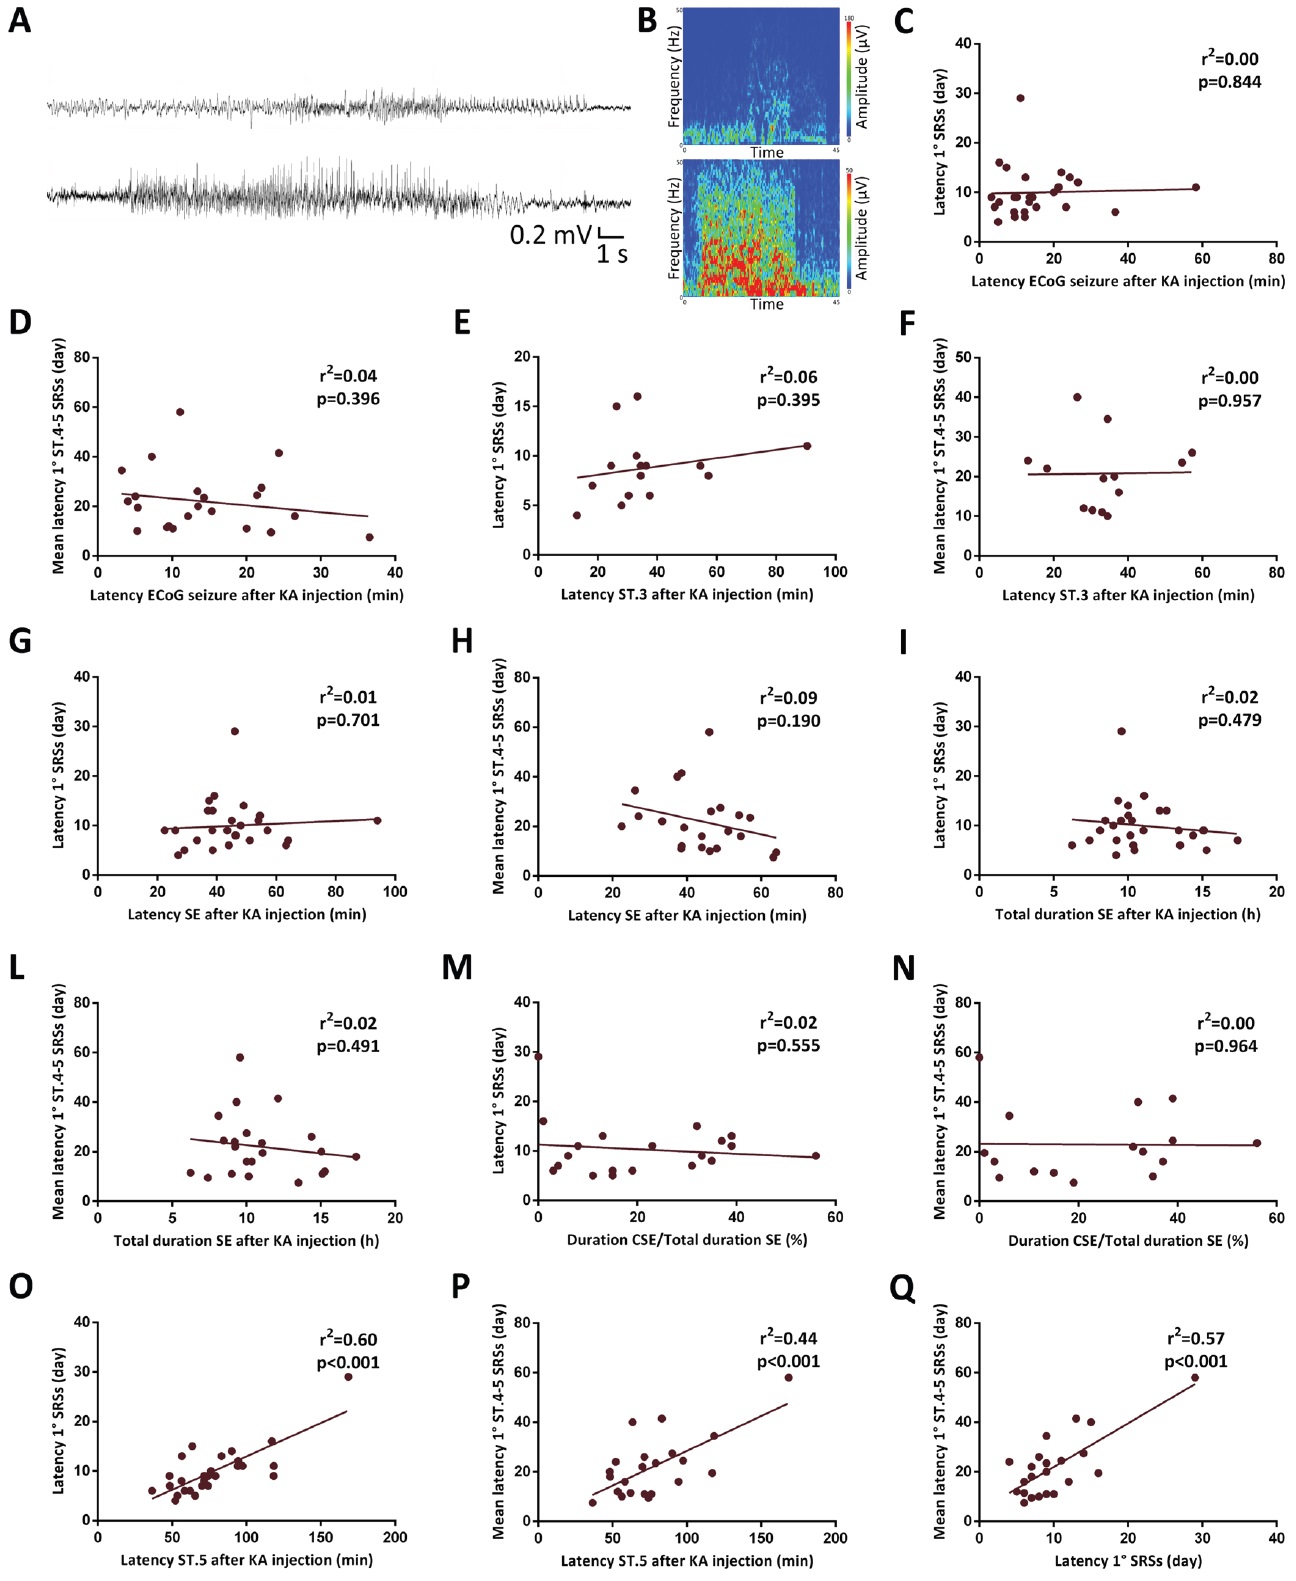
Fig. 5. Relationship between seizures after the administration of kainic acid (KA) and chronic epilepsy. In A, the first nonconvulsive (top) and the first convulsive spontaneous recurrent seizures (SRSs) (bottom) were reported. In B, the amplitude spectrum maps were shown for the first nonconvulsive (top) and the first convulsive SRSs (bottom). Relationships (r²) between the first electrocorticographic seizure after KA injection and SRSs were determined in C-D, while relationships between the first stage (st.) 3 seizure after KA injection and SRSs were determined in E-F. Relationships between the latency to develop status epilepticus (SE) and SRSs were determined in G-H, whereas relationships between the total duration of SE and SRSs were determined in I-L. Similarly, relationships between the percentage of time spent in convulsive SE over the total SE duration and SRSs were determined in M-N. Moreover, relationships between the first st. 5 seizure after KA injection and SRSs were determined in O-P, while the relationship between the latency to develop the first SRS and the mean latency to develop the first convulsive (st. 4-5) SRS was determined in Q. Statistical analysis was performed using a linear regression analysis. Scale: 0.2 mV/1 s. CSE, convulsive status epilepticus; ECoG, electrocorticography.